
From $540,000 to $1.2 Million:
The Macon Storage Center Turnaround
How improving revenue, reducing unnecessary expenses, and correcting inaccurate property records helped transform an existing self-storage facility in just 16 months.
This is an investment my partners and I acquired, operated, and sold. It is not a consulting-client result, a statement of net profit, or a promise of future performance.
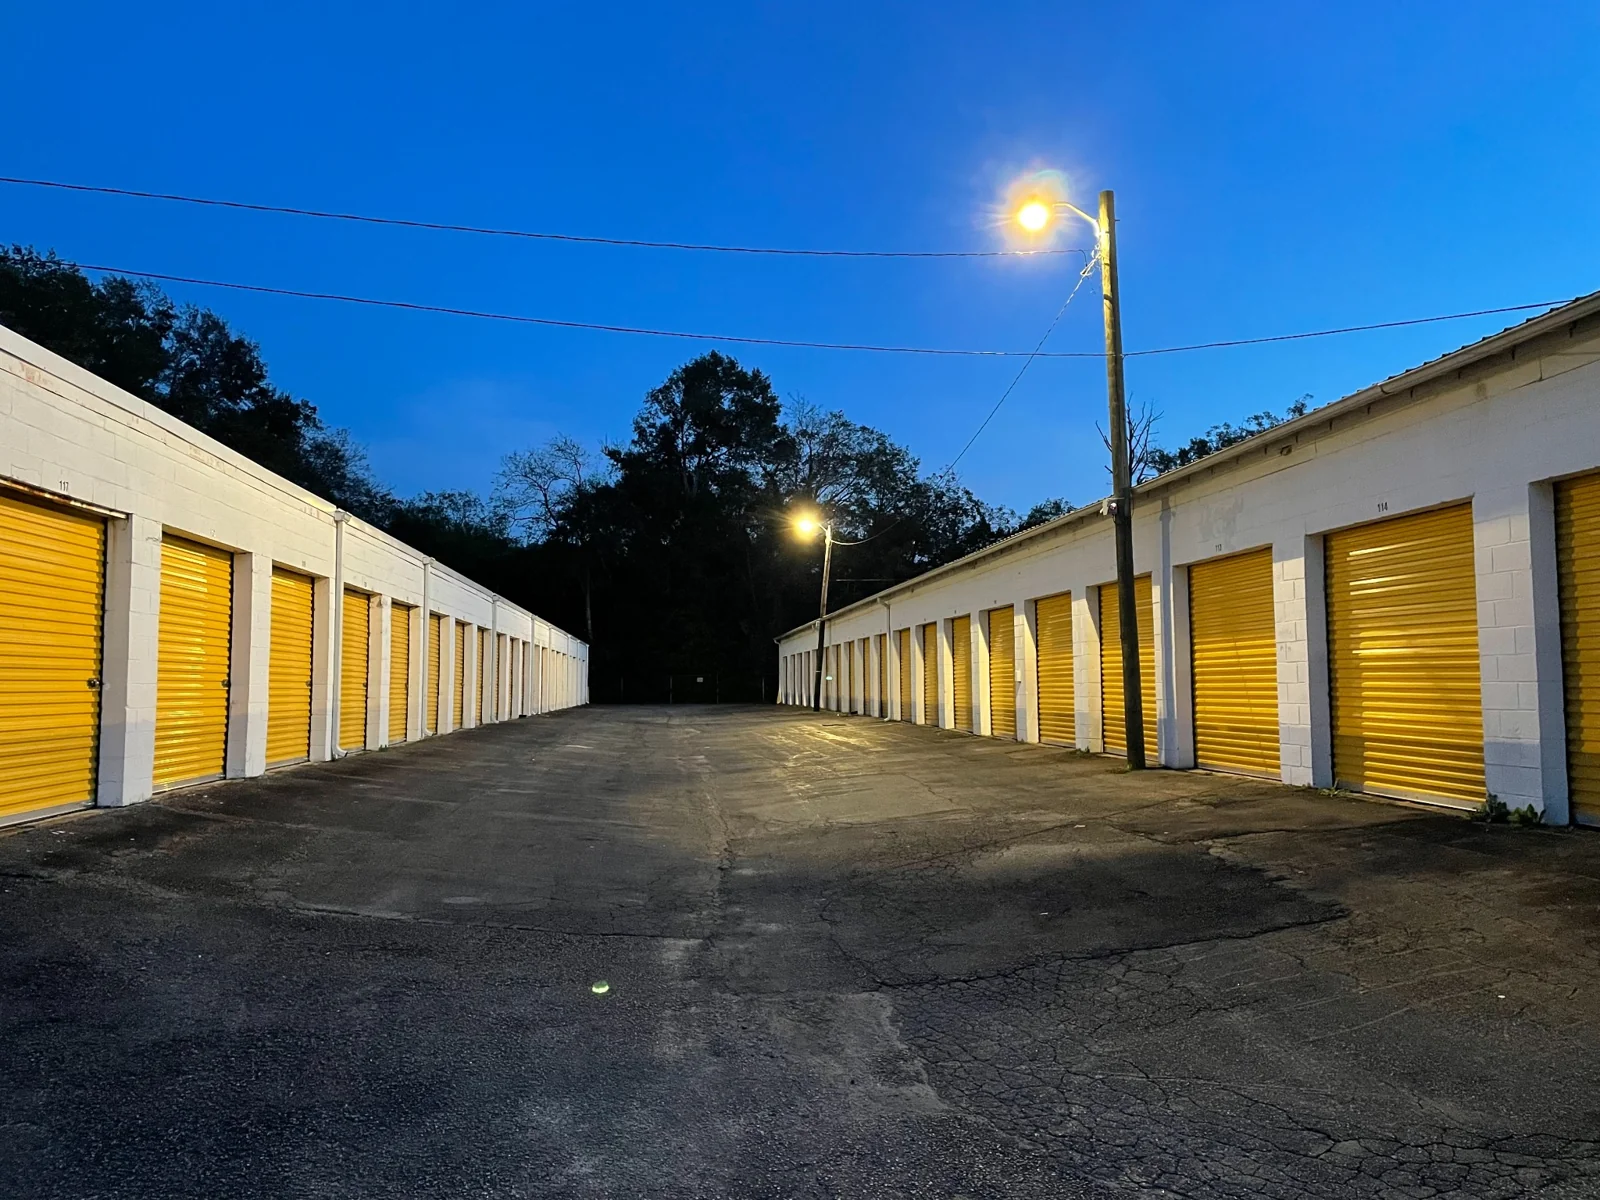
The buildings were there.
The operation needed
a closer look.
In 2021, another investor contacted me about a facility in Macon. I had been telling other investors I was looking for more than 20,000 rentable square feet in the Southeast. This property fit.
It already had tenants, buildings, and third-party management. The broker’s financial analysis pointed to an operating expense ratio of 57.4% and street rates roughly 25% below nearby competition.
The opportunity was primarily an operational turnaround. There was no expansion land and no major construction project in our plan.
The property at a glance
- Location
- Macon, Georgia
- Buildings
- Four
- Site
- Approximately 1.6 acres, no expansion land
- Corrected rentable area
- Approximately 22,425 sq. ft.
- Unit count
- Approximately 156, per the investment presentation
- Total capital invested
- Approximately $600,000, per the presentation
The original broker documents listed 21,475 rentable sq. ft. and 150 units. Our subsequent review identified inaccuracies in the property records.
Start with what
the business spends.
The broker’s roughly 57% expense ratio stood out immediately. The acquisition analysis included $12,000 in payroll and a $4,189 management-fee allowance. The broker identified that management allowance as a modeled 5% fee.
We changed the staffing and management approach after acquisition, with a focus on a more efficient operation.
We also implemented a call center so prospective tenants could reach someone and get assistance. The objective was a more efficient operation that still served customers.
$12,000 payroll + $4,189 modeled management allowance
These amounts total two lines in the acquisition analysis. They do not establish actual cash savings. Replacement services, call center costs, and other operating changes affect the net result.
Price the space
more intentionally.
We reviewed below-market rates and implemented a more intentional pricing strategy.
Scroll the rate comparison horizontally to see every column.
| Unit size | Original broker rate | March 2023 standard rate | Increase |
|---|---|---|---|
| 10×10 | $42 | $69 | 64.3% |
| 10×15 | $69 | $99 | 43.5% |
| 10×20 | $75 | $119 | 58.7% |
| 15×15 | $99 | $129 | 30.3% |
| 15×20 | $140 | $149 | 6.4% |
| 20×20 | $160 | $169 | 5.6% |
Original rates supplied by Shane. The March 3, 2023 rent roll confirms the displayed standard rates. Bars share a $0–$180 monthly scale. Individual tenants may have paid different rates because of timing, concessions, or existing agreements. These figures do not establish collected rental income.
Strategic rate management can increase gross potential revenue using the space that already exists. It does not require another building, but it does require understanding the local market and the effect on your customers.
Look beyond
base rent.
We implemented mandatory tenant protection as part of Macon’s operating strategy. Ancillary income can contribute to financial performance alongside rental income.
No specific revenue amount is attributed to tenant protection here. What can be offered or required depends on applicable rules, lease terms, and the program structure.
Make the property
work better.
We upgraded lighting and signage to support better functionality and a more professional appearance.
These were improvements to an existing facility. We did not add buildings or expand the property.
The missing square footage
was already there.
The broker’s unit mix listed ten 5×5 units. When we examined the facility, those units were actually 10×10s. That correction alone added 750 rentable square feet to the records.
The broader review identified approximately 950 additional rentable square feet in total. This was existing space that had been incorrectly documented.
We didn’t have to build another building to find those 950 square feet. They were already there.
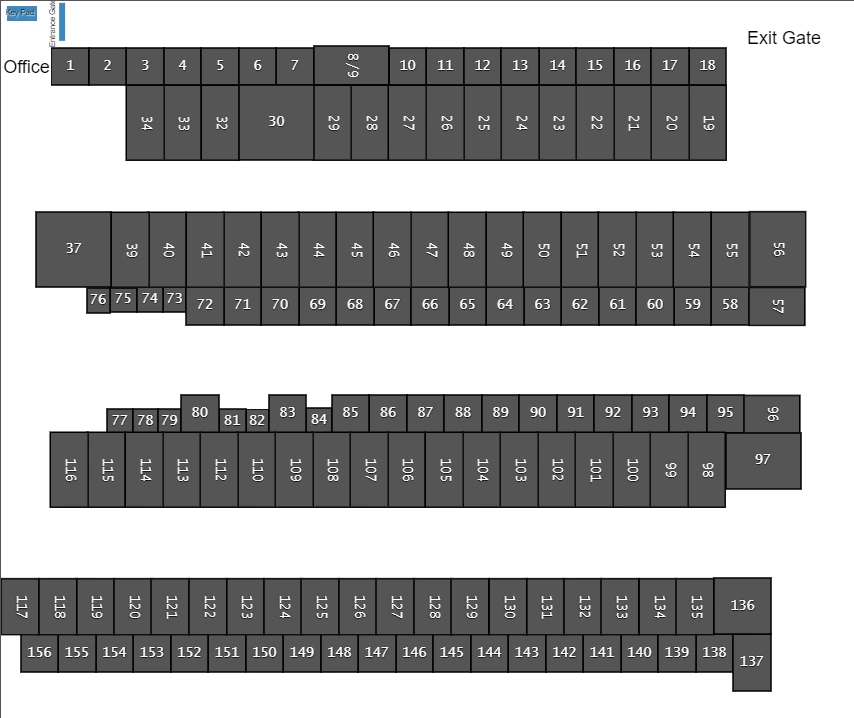
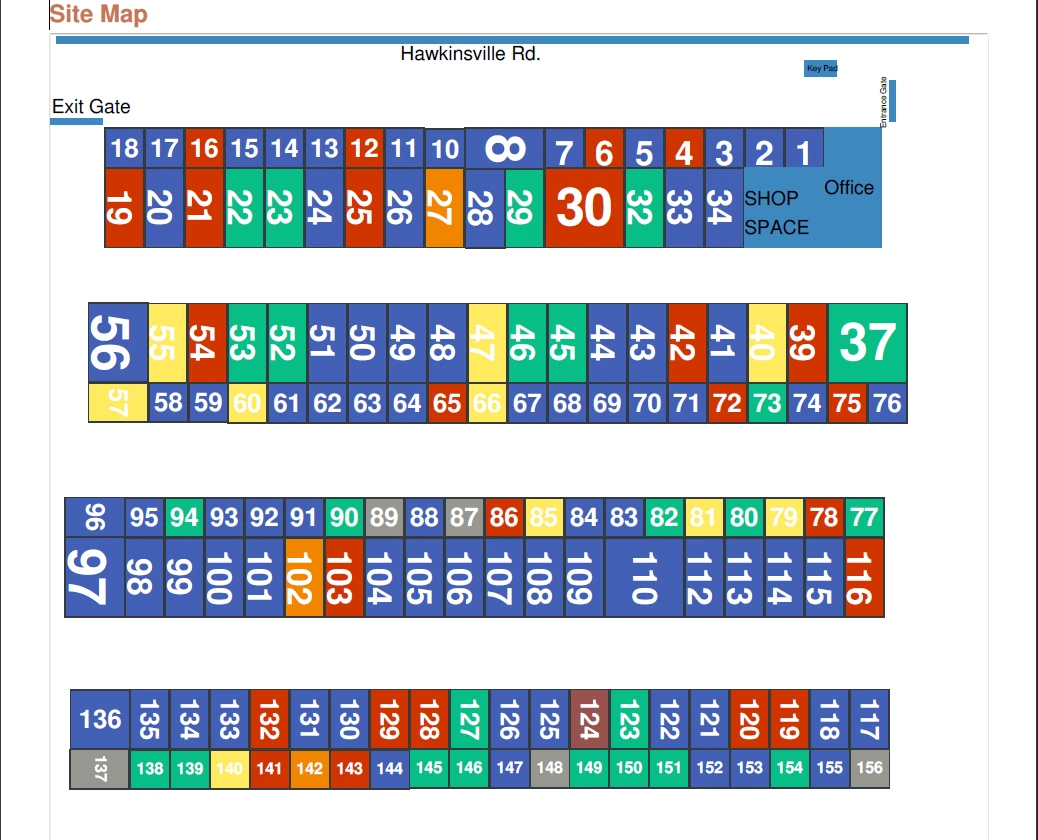
These are the supplied maps, displayed without redrawing the property layout. The corrected map’s account-status legend is cropped out to avoid publishing tenant account-status details. The corrected totals are reported in the investment presentation, rather than newly measured from these images.
It pays to verify unit dimensions, site maps, and unit counts against the rent roll. Then check rental pricing, gross potential rent, and actual rentable square footage. A mistake in one record can carry through the rest of the business.
The reported
operating picture.
57.4% expense ratio in the broker analysis
The acquisition materials label the reporting basis as trailing six months. The analysis includes broker adjustments and allowances.
Approximately 40% expense ratio, reported by Shane
The investment presentation attributes this income figure to the 2022 P&L. The ending expense ratio comes from Shane’s operating account.
The broker analysis and the 2022 P&L figure are not reconciled to an identical reporting basis. No percentage revenue growth or measured NOI increase is calculated from this comparison.
The later operating picture included higher published rates, a corrected unit mix, a call center, tenant protection, and improved lighting and signage. Shane attributes the reported expense-ratio improvement to revenue management and a leaner operating structure.
November 2021
to March 2023.
We bought Macon Storage Center for $540,000 and sold it for $1.2 million after approximately 16 months of ownership.
The investment presentation reports approximately $600,000 in total capital invested and $80,178 in cash flow generated during ownership.
Sale price is only part of the investment story.
The difference between the purchase and sale prices is not net profit. Financing, selling expenses, transaction costs, and other factors affect what investors actually receive.
No IRR, investor distributions, or net investment return is presented here. The cash flow figure is reported in the presentation and has not been independently audited for this website.
Purchase and sale prices, the holding period, reported income, and ownership cash flow are drawn from Shane’s Macon investment presentation, dated October 10, 2023. The original expense figures come from the broker financial analysis reproduced in that presentation. The March 3, 2023 rent roll corroborates the displayed standard rental rates.
The operational changes, original-rate comparison, and approximately 40% ending expense ratio are reported by Shane. These figures are not an independent audit or a reconciliation to closing statements and the underlying 2022 P&L. Broker allowances are distinguished from actual cash expenses, and the income figures use different reporting bases.
What Could Be Hiding
in Your Facility?
Macon shows the value of understanding the business behind the real estate. Some of the biggest opportunities aren’t found in buying another facility or constructing another building. Sometimes they’re hiding in the property you already own. You just need to know where to look.
- Are my rental rates competitive?
- Am I paying for services I don’t need?
- Are prospective tenants able to reach us?
- Am I capturing appropriate ancillary income?
- Is my unit mix accurate?
- Do I know my actual operating expense ratio?
- What would increasing NOI mean for my property’s value?
What Opportunities Could Be Hiding in Your Facility?
A conversation about your operation and the changes worth exploring.